More than 5 billion USD have been raised in June, the end of EOS marked a new ICO record with 4.2 billion USD and 81% of ICOs were classified as spam. This report conveys the current market of Initial Coin Offerings and Security Token Offerings in the second half of 2018.
2017 vs. 2018
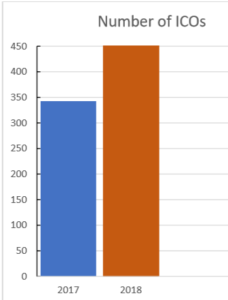
In 2018 (till now), already more ICOs have been scheduled than in the entire year of 2017. Same counts for the capital that investors put into the market.
Comparing the average size of a project, it highly increased from 12.8 million USD back in 2017 to the amount of 25.5 million USD in 2018. And that is of course a consequence of EOS closing its billion dollar ICO this year and driving the increase of the average funding.
The USA: regulation coming into place?
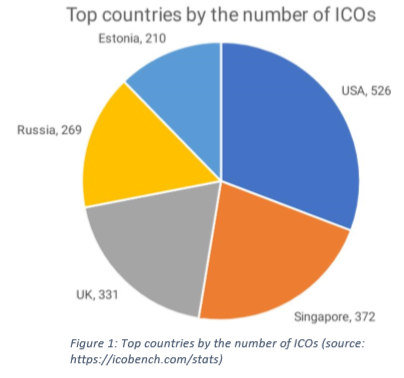
Although many projects step away from every square based in the USA, the United States remain being the region with most ICOs ever executed. Since the SEC is following very strict rules and many people are scared of the classification as an investment vehicle, many projects exclude US investors. Nevertheless, many ICOs in the past still make them to the country with most of the ICOs.
To see all graphs, statistics and numbers, have a look at the publicly available PDF that you can download in one click.


